Stock Tips: Introduction To Financial Statements 1
This is a continuing series how to use fundamental analysis to pick stocks to invest in. The aim of this blog is not only give information, but to educate, that way we are able to make independent saving and investment decisions.
If you are reading this for the first time, read the introduction to fundamental analysis here and the second post on qualitative analysis here. Today, we’re getting into quantitative analysis, which is the use of figures and data about the company to determine whether its stock would be a good buy or not. Most quantitative information can be found in the company’s financial statements (and thankfully, most financial statements for companies in the NSE are readily available on the web now).
Financial statements typically consist of very many tables, figures, notes and explanations, but the major elements of a company’s accounts are:
1. Balance Sheet
2. Income Statement
3. Cashflow Statement
Today we focus on the balance sheet.
THE BALANCE SHEET
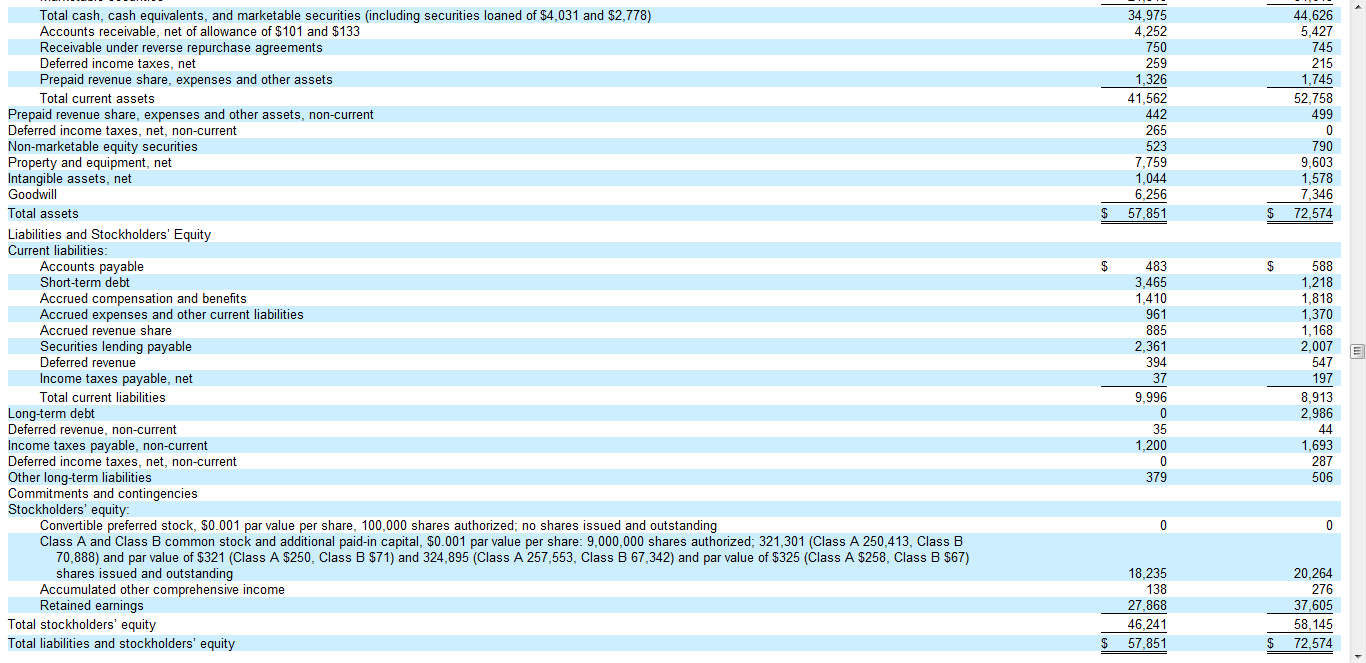
This is a listing of a company’s assets, liabilities and equity at any one point in time. To understand the balance sheet better, we will look at the Google 2011 financial year balance sheet below (click on the image to enlarge it). See this for the full financial statements.
A balance sheet has three components:
1. Assets:
These are the resources that an organization controls or owns at any given time, or expects to benefit from in the future. Assets could be tangible, in that you can see or touch them, for example property and cash. They could also be intangible for e.g goodwill, patents etc, representing inherent value created by the business. Assets could also represent claims to other entities, e.g when an organization sells it’s commodities on credit, then it books that sale as an asset (debtors).
A common misconception here is that for every company, assets such as machinery, and property (especially for Kenyan companies) are the most valuable, and should represent a bigger proportion of the company’s assets. This is often, but not always the case. In the Google example, you realize they hold more in cash and its equivalents, than in fixed property ($34, 975 Vs $ 7,859). If the business isn’t a production or property heavy business, then it’s quite in order for it’s other assets to be worth more than the P,P &E (Plant, Property and Equipment).
In most financial statements you will encounter, assets are then further classified into two:
a) Current Assets– These are assets that are used for the day to day funding of the business, and can be (or are expected to be) converted into cash within one financial year. In a typical company, these include cash, short term investments, debtors etc.
b) Non Current Assets – Long term assets are those that do not expect to be converted into cash within one financial year, and aren’t used up in the day to day running of the business. Land and buildings, motor vehicles, furniture etc are all examples of non-current assets.
2. Liabilities
Liabilities are a company’s legal debt or obligations that occur in normal course of business. These include payables, loans, mortgages etc.
Liabilities just like assets are classified into two, current liabilities (due within the financial year), and long term liabilities (due in a period longer than 1 year).
3. Equity
This represents the amounts the owner has contributed into the business (share capital), and the accumulated business profits or losses (retained earnings).
Next time, we look at the income statement.
This post has been a marathon introduction to accounts, please let me know if it’s helpful, or if there are areas you feel I should clarify further.


1 Comment