This Is Why Your Uber Driver Wants You To Take The Longer Route
This is a guest post from Latiff Cherono, he first tweeted about this, and was kind enough to write a post about it on my request. He is a Manufacturing Process Engineer, he helps businesses improve and optimize their processes. Follow him on Twitter—> @LatiffCherono
Have you recently taken an Uber ride in Nairobi and found that your driver was intent on making your trip to be as lengthy as possible?
My Uber driver is trying to pick every high-traffic route option possible, and I’m killing his joy at every junction. #notwithmymoney
— Mo (@MoSande) October 22, 2016
After talking to many Uber drivers, I come to the realization that this perception may not be far off the mark, but not for the reasons you may initially think i.e. “My Uber driver is trying to scam me!”. Based on the response my tweet about this issue generated, it is clear that the “long trip scam” is not a perception, but something that has affected many Uber rider. In this post, I try to understand the root cause of the disconnect between how the customer (who defines the value), Uber (the service that controls the experience) and the driver (the one who provides the service).
First things first (disclaimer preamble).
- I am not affiliated in any way to Uber Kenya, other than being a user of their service. My motivation to answer this question is simply to understand the root causes for process anomaly.
- Any data used in this article is in the public domain (e.g. Uber Fare rate) or estimated (where noted).
- I don’t have any access to Uber’s IP (their data), nor do I claim to be an expert on Uber’s processes and business models. Please consider this article only as a guide and not the holy truth.
- Rider – Someone who uses the Uber service
- Driver – A person who enters an agreement with Uber as an independent contractor.
Background
There’s absolute no question that Uber has transformed transportation in Nairobi. As riders, we now have access to affordable, predictable, safe, and comfortable transportation. When Uber Kenya slashed their rates by 35% at the end of July 2016, a whole new swath of customers has been able to use the service that they may have regarded as a luxury. However, this reduction in rates has not been so popular with the Uber Kenya drivers, resulted in a strike on August 2nd 2016.
The clear winners from this rate reduction were the riders and Uber. The riders benefitted by being able to afford more trips. Uber Kenya was able to fend off competition from the growing number of ride-sharing companies (Little Cabs, Mondo Ride, Dandia etc). But what about the drivers? Those who were with Uber before the rate reduction, are understandably, the most vocal about income loss. But what about the drivers who joined Uber after the reduction? Why would they feel it necessary to mislead riders about their ride length? That was the question I asked myself when I saw the tweet posted at the start of the article.
Breaking Down an Uber Driver’s Income
There are some assumptions we must make in order to deduce how an Uber driver makes an income. These assumptions are as follows:
- Typical Vehicle is a 2009 Toyota Allion (fuel economy 20 km/liter of petrol, Toyota “A” Service – occurs every 5000 km at KES 8000).
- Fuel Price – KES 84.25 / liter
- Average trip length and time does not take into account traffic conditions or driver availability (i.e. factors affecting surge pricing). It should be obvious that surge pricing should significantly increase a drivers profit.
- For the sake of simplicity, I also did not account for Vehicle depreciation (this would be part of a driver’s operational expenses) and long term maintenance (Toyota “B” and “C” Service).
Also note that the Kenya Revenue Authority has recently declared VAT falls under the responsibility of the drivers and not the platform that they are contracted too. Read more about that decision on the Techweez blog.
Let us assume an Uber Kenya driver has a personal weekly target to generate Ksh 50,000 from Uber. This is before the deduction of Uber’s fee, operational expenses and VAT. As he or she has budgeted their livelihood to match this income, when the fare reduction went in place, they had no choice but to attain the same target.
The breakdown of his/her earnings before and after the rate reduction would look something like this:
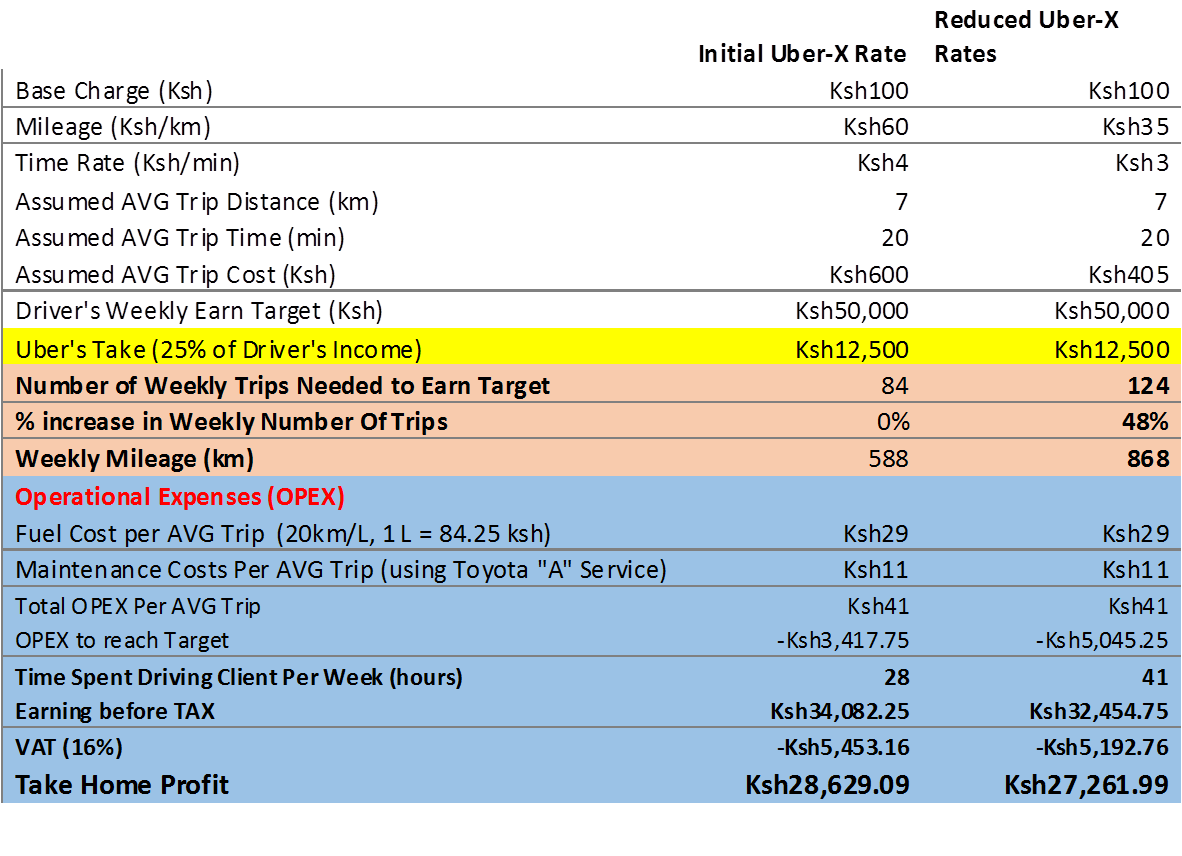
It is interesting to note is that while the difference in take home profit is only a 5% reduction, the increase in the number of trips needed to achieve this amount rose by 48%. This not only includes fuel and maintenance costs, but more importantly, time. The extra 13 hours the driver would have to spend ferrying riders around is time he or she could have spent on another value adding job. NOTE that the time listed above does NOT include the time spent when the vehicle is emptying. Thus the actual time increase is much larger than in stated above.
One solution for this would be a reduction in Uber’s fee. If uber reduced their rate from 25% to 15%, the change in this driver’s weekly income would increase by 10%. The impact on reducing the fees should have a minimal impact on Uber. Their costs per driver are marginal and actually reduce when they gain more scale.
The Real Reason Why Drivers Continue to Make Riders Take Longer Trips
While the table above explains why the Uber drivers are not happy with the rate change, it does not fully explain why some uber drivers are resorting to misleading their clients on trip length. What I looked at next was how the length of Average Trip affected take home profit of an Uber driver.
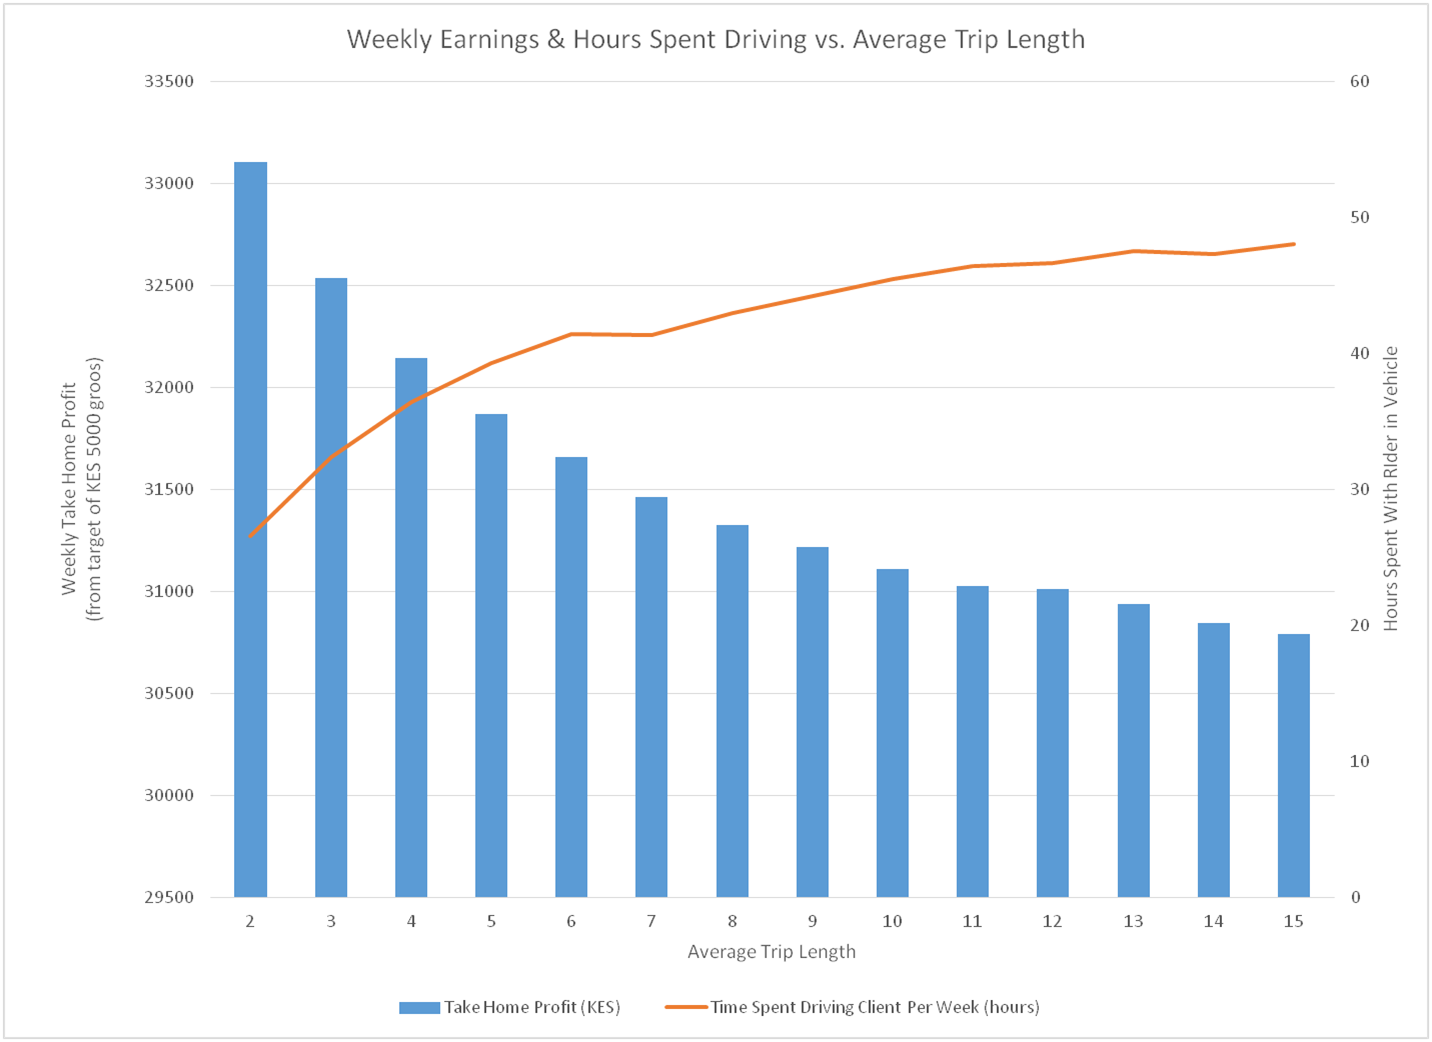
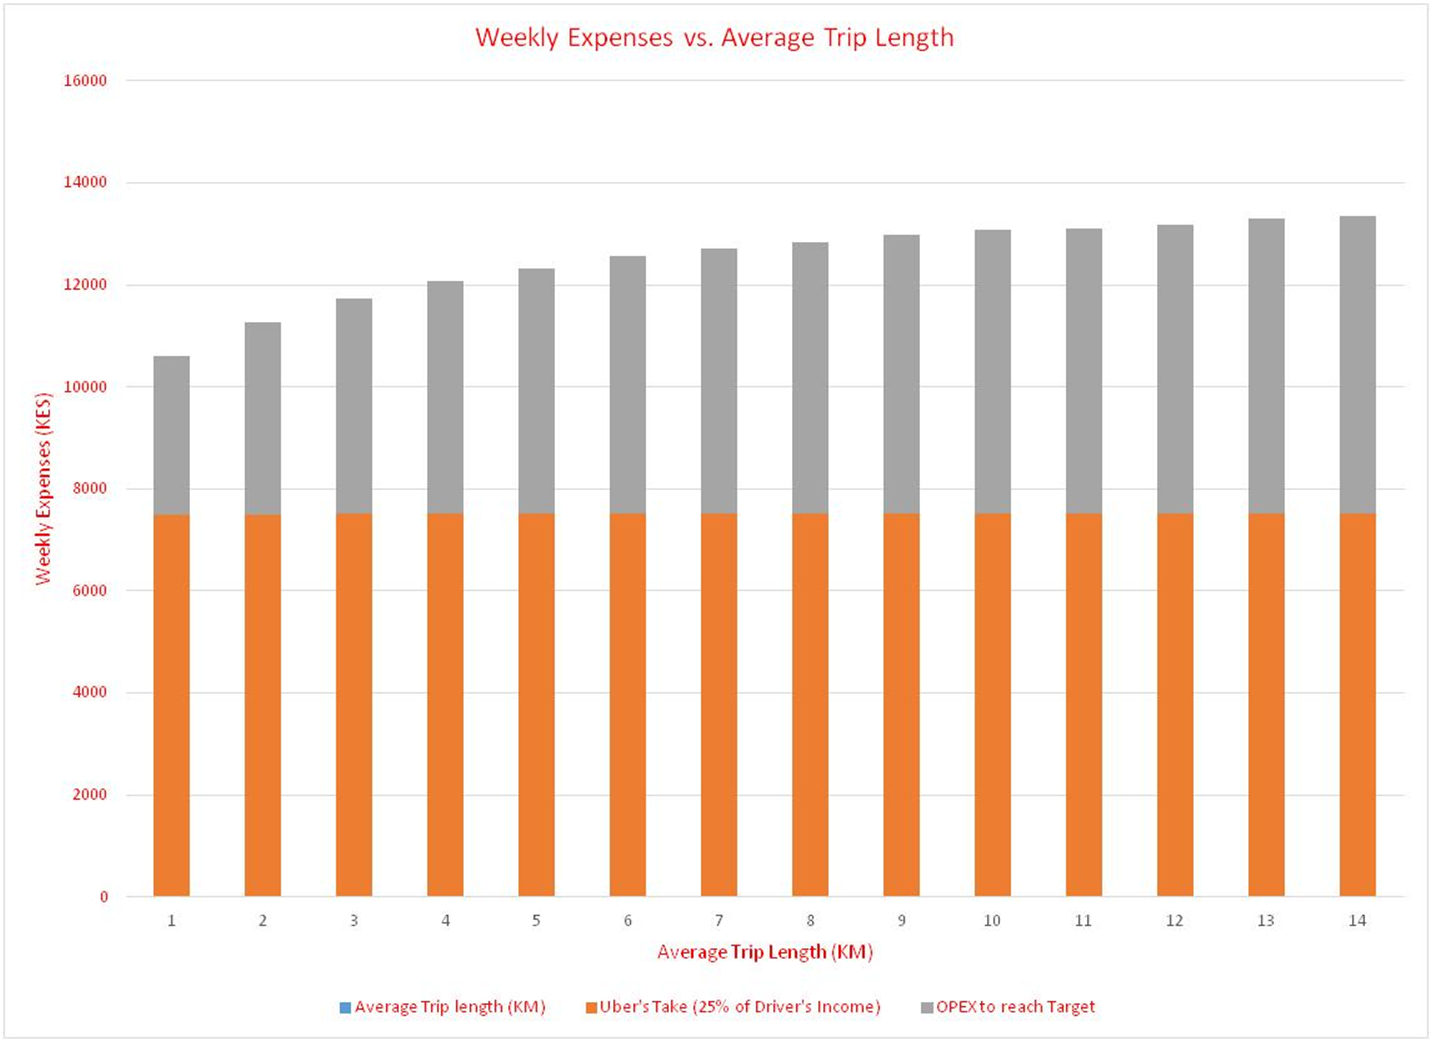
This chart clearly shows that all things being equal, a driver will take home more profit, the shorter the trip. The reason for this is the impact the initial fee charge (KES 100) has on the trip. The shorter the trip, the more money the drivers retains. Ironically, the driver will also spend less time driving. In other words, the longer the trip, the more hours he or she spends driving to earn less. If we compare the operating expenses to the average trip length, we can also see that longer trips actually have higher operating expenses. It is also important to note that regardless of the trip length, as long as the driver meets their weekly target, Uber’s take remains constant.
To meet the weekly KES 50,000 target, the driver will have to make a total of 266 trips (average length 2 KM) versus a total of 67 trips (average length 15km). Even though the total time driving for the shorter trips is smaller than that of the longer trips, the probability that the driver will have his/her phone pinging with new rides is lower.
So if this data shows that drivers should be focusing on many small trips as opposed to longer fewer trips, why does the long-trip phenomenon exist? I speculate that they are several possible answers:
- The perception of the drivers is still stuck in their old Taxi Cab business model. Because they didn’t have fixed rates, the longer the trip the more opportunity the Cab driver had to overcharge for services. However, as we have seen earlier, this thinking is still flawed because operating expenses increase for longer fewer trips.
- How Uber Measures Drivers Performance. If Uber is measuring the drivers on the time spent carrying customers, then the driver’s behavior will change to match this metric. As the infamous management saying goes, “You get what you measure”.
The incentive for any person who starts a business is to maximize their profits. As such, we should expect that Uber drivers will approach their business in the same vein. However, the data provide by Uber to the driver is limited and prevents them from making informed decisions about generating revenue. For example, drivers do not know the estimate distance of a new trip when they accept it via the app. They are also penalized for not accepting rides (even if that trip may not make financial sense to the driver). All this is by design as Uber wants to maintain a steady supply of “online” vehicles on their network. One may argue that Uber is not being transparent enough with its independent contractors.
If you would like to read more about Uber from the driver’s perspective, start with the UberPeople blog.
Conclusion
Regardless of whether my analysis holds any water, the issue of reduced service levels and unhappy drivers is something that Uber not only in Kenya, but globally, will have to resolve if they are to have a sustainable future. The next time your Uber driver tries to take you on a long trip, have a conversation with him/her and understand why they are making that decision. If you educate them that we are all in this ecosystem together and such behavior not only doesn’t make sense (and cents), but also creates mistrust, then we can stop it from happening.
There is more than enough value to be shared among all parties in the ride-sharing ecosystem.
If @uber_kenya dropped their cut by a few % points, everyone in the value chain benefits. make , get service. Uber still makes .
— Latiff Cherono (@LatiffCherono) October 22, 2016