
Scaling in East Africa: Has Uber Peaked in Kenya? – Part 3
This is a guest post from Latiff Cherono. Latiff is a Manufacturing Process Engineer – he helps businesses improve and optimize their processes. Read his first post on this blog, about why your Uber driver may want to take the longer route, and follow him on Twitter—> @LatiffCherono
As Uber approaches its second anniversary in the Kenyan market, there is sufficient reason to believe that Uber may have reached its peak in terms of growth. This series of articles seeks to understand the sustainability of the ride sharing business in Kenya, focusing on the incentives driving the three key stakeholders in the ride sharing ecosystem. Part 1 of this series discussed the data points that showed why Uber (as the platform owner) has plateaued on customer growth, Part 2 evaluated the incentives driving Uber Partners. This final article looks at the third element in the equation; the Uber rider.
The Rider
Whenever I take an Uber cab, I have made it a point to chat to Uber Partners on how they are faring in their business. I was thus able to determine the following trends:
- Uber rides peak on the weekends (Friday, Saturday, Sunday). Most these trips are for entertainment and errands (e.g. shopping). These weekend trips occur all over the Nairobi and are not relegated to wealthier/business neighborhoods.
- Uber rides during the week concentrate primarily around the Central Business District and other mixed mode neighborhoods that are primarily focused on enterprise e.g. Upper Hill, Westlands, Kilimani, Gigiri. The fact that many Uber drivers will opt not to work on Sunday/Monday or Monday/Tuesday supports this trend.
- Middle Class areas that are prone to heavy traffic jams in the morning and evening will be underserved by Uber. These areas tend to be further out from the Business regions listed above (e.g. Langata, Buru Buru, Ruaka, Soykimau). Affluent residents in these areas are more likely to have a car than to opt to use Uber daily.
- Uber rides peak at the beginning of the month (after salary remuneration) and dip as the month progresses. Interestingly, this follows the same trend in Nairobi Traffic as more vehicles are driven in the first half of the month as compared to the second half of the month.
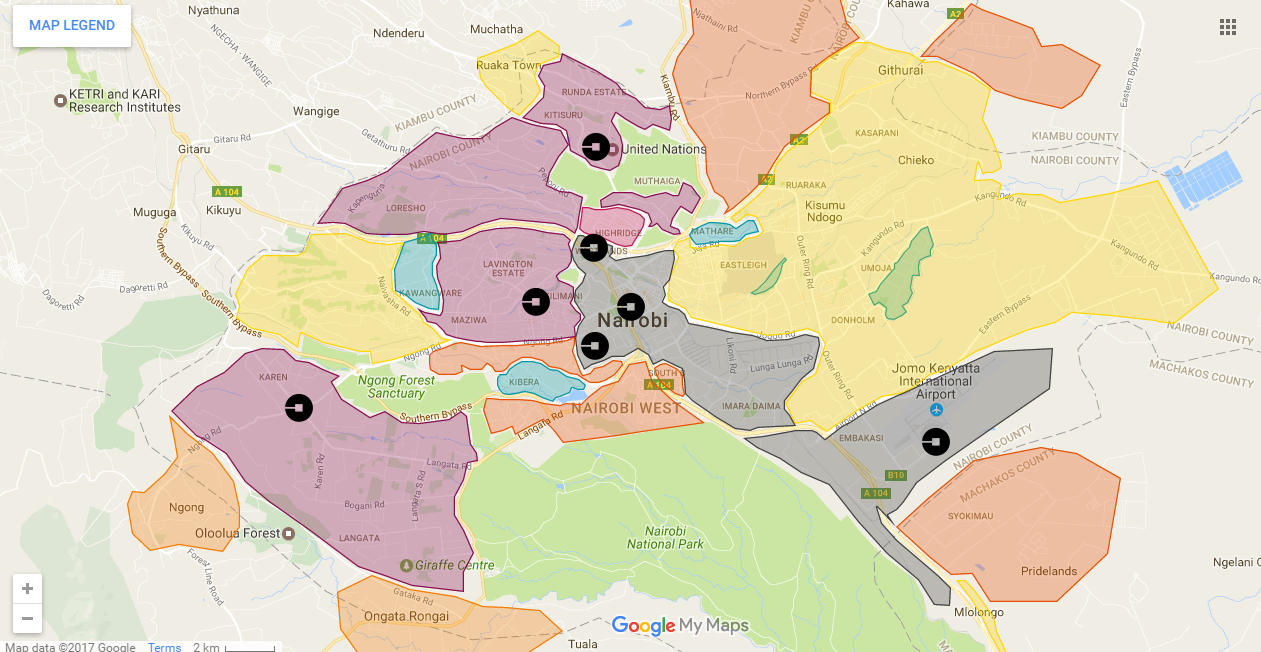
Figure 1: Uber High Traffic Zone Vs. Neighbourhood Income Distribution (Link to GooGLE MAPS)
Based on my knowledge of Nairobi wealth distribution, I mapped these neighborhoods the areas with constant Uber demand. Key: Uber icons – Uber High Traffic Zone, Purple – Upper class (Above KES 150,000 per month), Orange – Low upper to middle income (KES 60,000 to KES 150,000), Yellow – Middle to low (KES 10,000 to KES 60,000), Light blue – Low income (below KES 10,000). You can interact with the above map via Google My Maps at the following link: Uber High Traffic Zone vs. Income Distribution in Nairobi Neighborhoods.
Using these insights, we can segment Kenyan Uber users into three user groups.
- Daily User – This user is most likely a well-paid professional, who lives and in a mixed mode neighborhood (e.g. Kilimani, Westlands). This user is bound to use Uber more than 12 times a week. I estimate the monthly income profile for such a user to be over KES 100,000 per month (S1000 per month). NOTE: While this user is the prime target for Uber, they are also highly likely to purchase a vehicle.
- The Weekend User – This user will use public transportation to commute to/from work during the week and then use uber for their Weekend errands. This user will average about 4 trips a week with UBER. The estimated monthly income profile for this user will be between KES 50,000 to 100,000 per month ($500 to $1000).
- The Occasional User – This user will use public transportation for most the time. They will only use Uber once or twice a month for specific purposes. The estimated monthly income profile for such a user will range between KES 25,000 to KES 50,000 per month ($250 to $500).
NOTE: It is also important to note that there is fourth group of Uber users that is active during the week. These are corporate customers whose rides are paid for by their organizations. Unlike some of its local ride sharing competitors (as well as traditional cab companies), Uber in Kenya does not offer a cooperate solution that allows companies to bill at the end of the month and thus manage cash flow. I did not include this segment of users in my analysis as I could not find any corresponding data.
To better understand how using Uber affects these three groups, as well as compare them to a typical car owner, we can use the tables below. Table 3 provides the baseline costs in calculating the commuting costs for each of the 3 groups.

Table 1: Baseline Cost Assumptions for Uber Rider Comparison
Note: The PSV vs Personal Car Commute Time Ratio helps us differentiate the amount of time taken to commute the same distance in a public service vehicle versus a private car. Thus, if a private vehicle owner commute takes 60 minutes, we can estimate that the PSV user will spend approximately 90 minutes to cover the same distance. For those not familiar with the Kenyan currency, you can easily to covert to US $ by KES 100 = $1. E.g. car cost KES 1,000,000 = $10,000.
Table 4 compares the 3 main Uber user groups to a private car owner. For ease of comparison, I used similar commute distances, as well the number of trips each person would make per week.
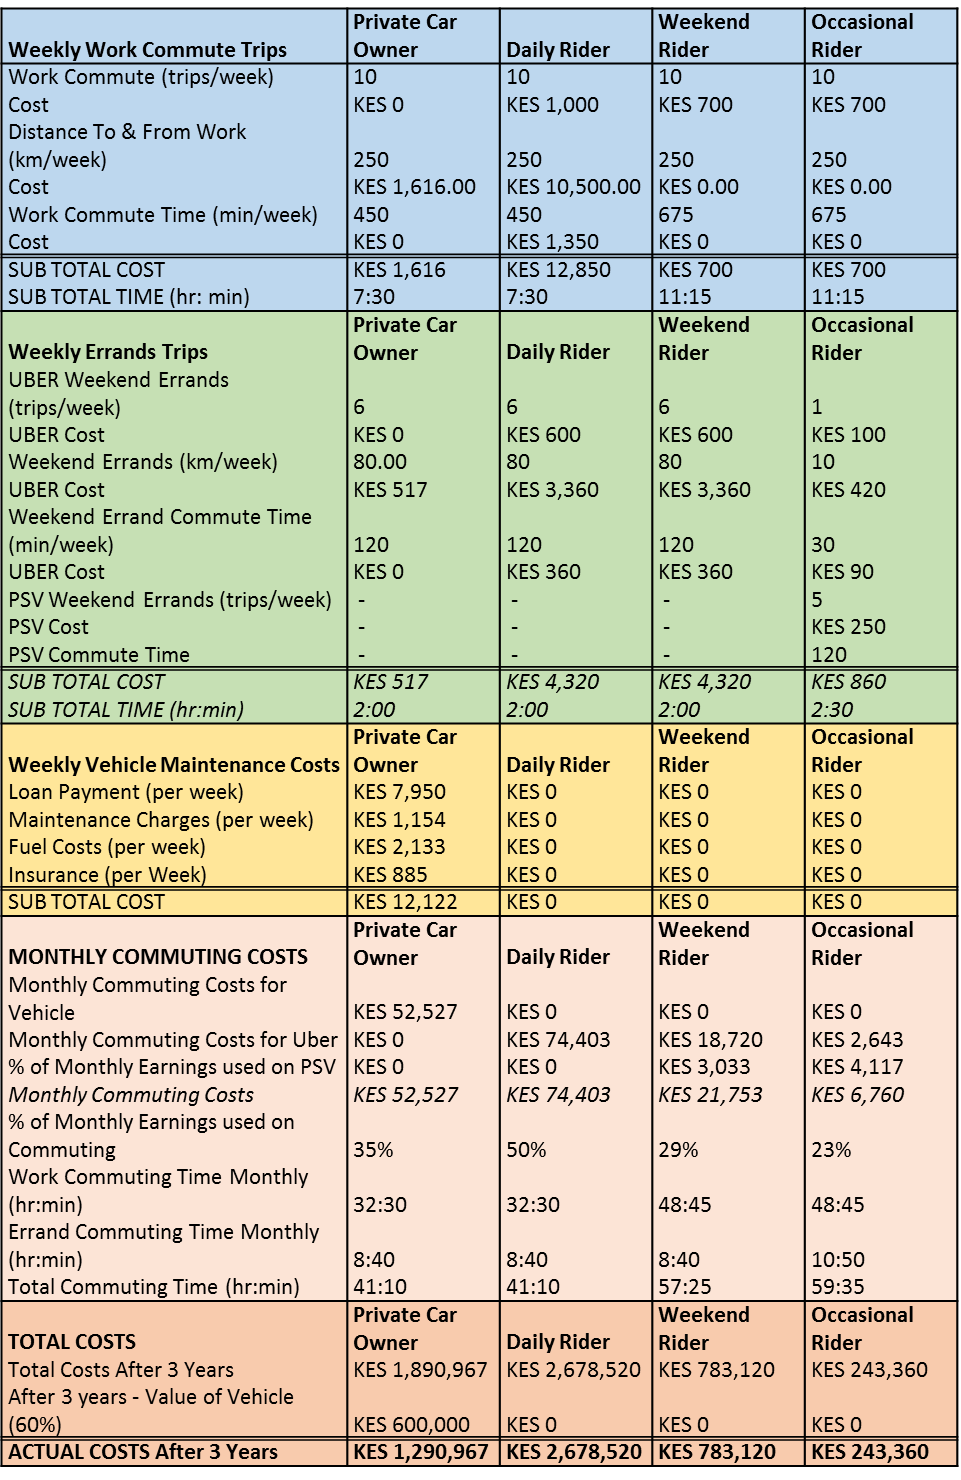
Table 2: Comparing the Commuting Costs of 3 Main Uber User Groups
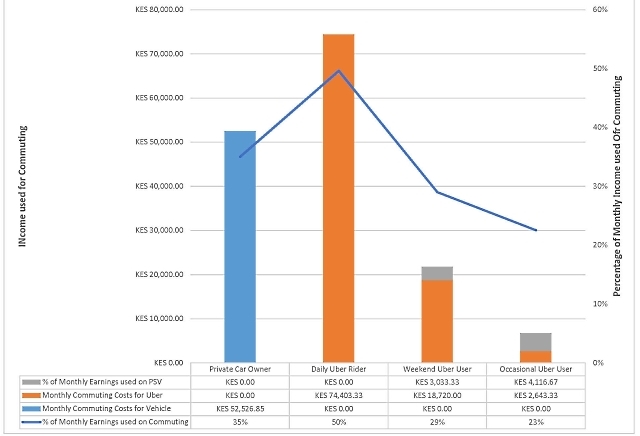
Chart 1: Commuting Costs of 3 Main Uber User Groups
Insights gleaned from the Figure 1, Table 2 and Chart 1:
- It is no coincidence that the Uber High Traffic Zones are situated close to commercial areas as well as upper income class neighborhoods.
- It is obvious that even though the daily Uber user group earns the same monthly income as the private car owner, their commuting costs are much significantly higher.
The current Uber pricing model in Kenya compared to our income levels invalidates the myth that ride sharing is cheaper than car ownership.
- The best customer for Uber is the daily user as they have the capacity to take more Uber rides. However, it makes more sense for this type of use to buy a vehicle, unless they live, work and play within in a small proximity radius.
- The amount of revenue brought in the weekend user and occasional user pales in significance to the daily user. Uber must on-board a lot more of these two user types to reach the same level of revenue. The cost for on-boarding these customers is most likely not worth the revenue that it will generate.
It is also important consider that as we spend time commuting, we are giving up the opportunity to do something else of value. This opportunity cost is calculated by generating a wage number (per hour) based on the user’s monthly income. Thus, we can say that if the daily user was sitting in traffic for one hour, then he or she lost their Monthly Salary/Divided By Number of Hours Worked in a Month. At 200 hours worked per week, the hourly wage for the daily Uber user is KES 750. If we then compare total commuting time to opportunity cost, we can see that the weekend user could reduce their opportunity cost if they chose a faster mode of transportation. However, Uber cannot capitalize on this as its current costs are out of weekly user budget.

Table 3: Commuting Opportunity Costs
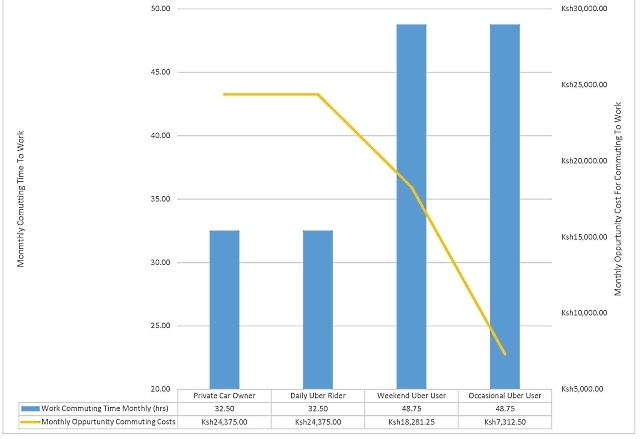
Chart 2: Opportunity Cost Lost Due to Work Commute
A possible solution to this dilemma would be for Uber to figure how to get more user to share rides during the week (i.e. commute car pools). As Uber can use their metadata to predict where each of their customers lives and works, they can create an “opt in” option that matches users who live in and work in similar areas and offer them a reduce fare if they commute together.
Finally, now that we know what type of customer is most desirable to Uber, where can Uber find them? The answer to this lies in looking at how wealth is spread in Kenya.
The Institute of Economic Affairs in Kenya released a study that helped define and quantify the middle class in Kenya. This study used data from the Kenya National Bureau of Statistics 2016 Economic Survey.
This study shows that in 2015, Kenya 12.56 million citizens earning a living in the informal economy while 2.48 million earned their living in the formal economy.
Due to the complexities and lack of data describing the income levels within the informal economy (i.e. the economy that is neither taxed or monitored by the government), I will first focus on the formal economy. Using the data from IEA, Charts 8 and 9 show the distribution of the 2.48 million formally employed citizens, we can discern the following:
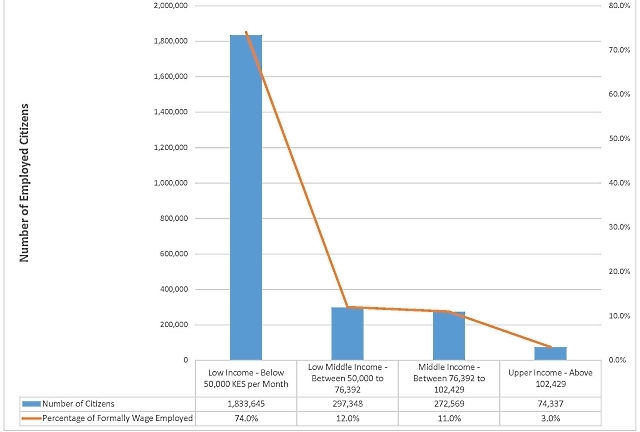
Chart 3: Distribution of Income in the Formally Employed in Kenya
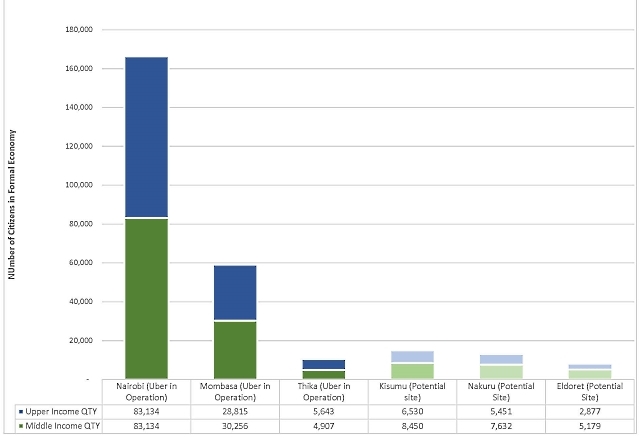
Chart 5: Potential Uber Customers in Kenya – By City
If we look at the Middle and Upper income brackets for the three cities that Uber is currently operates (i.e. Nairobi, Mombasa and Thika), we can see that that these three cities only provide a total pool of 235,899 potential riders who are formally employed. The next 3 largest towns in Kenya (Kisumu, Nakuru and Eldoret) would only add just under 36,000 formally employed potential riders.
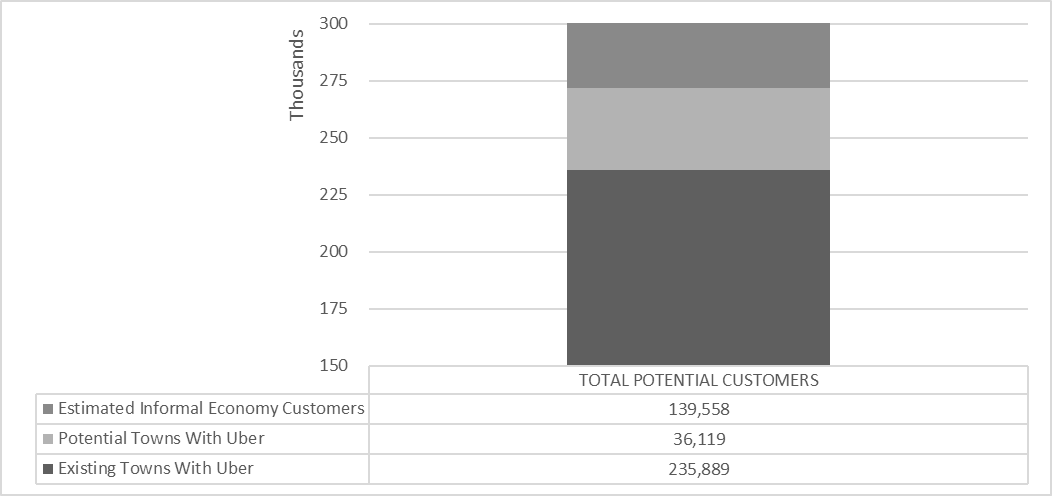
Chart 6: Potential Uber Customers in Kenya – Total
In order not to discount the top tier of informal economy participants as not being able to user Uber services, I will make the assumption that this tier equals the size of the middle class in the formal economy), then the total Uber customer pool in Kenya is just over 411,000 people. We can then use the following assumptions to estimate Uber’s actual predicted customer base.
- Assume that of the 411,000people, 90% of upper income and 40% of middle income own cars and thus are not likely not to use Uber, we are left with a pool of 230,00o potential customers.
- If Uber manages to convert 20% of this pool of potential customers into regular user of the Uber service, the predicted max pool of Uber Customers equals 46,000 customers.
- If the average Uber customers takes 3 trips a month, the Uber will Max out at under 140,000 rides per month. This assumes that Uber adds Nakuru, Eldoret and Kisumu and markets aggressively to increase the number of rides per customer.
It is clear to see that the Uber’s data point of having 100,000 potential riders is not only feasible, but most likely their upper limit. I would not be surprised to if the number of actual rides per month is between 50,000 and 70,000 rides per month.
Conclusion
It is my contention that Uber in Kenya has found itself in a quite precarious position.
Uber is close to exhausting its existing pool of available customers. It is also facing stiff competition from other Ride Sharing services in the market (Taxify from Slovenia, Little Cabs from Kenya, Mondo Ride from Saudi Arabia) as they all try and work from the same pool of customers.
Even if Uber can innovate and introduce features such as “Share A Commute” plans and leverage their platform for enterprise customers, it is highly unlikely that they will be able to scale up to the 500,000 rides per month figure anytime soon.
Uber Kenya Taxes Since 2014 (Millions)
PAYE – Sh7M
VAT – Sh19M
Income tax – Sh5M
_______
20 staff members
Drivers are Indepedent Contractors pic.twitter.com/2iBZ950nnk— Kenyanwallstreet (@kenyanwalstreet) March 21, 2017
If you have any doubts that Uber in Kenya is making slim profits, then consider the data in the above tweet. If this data is accurate, then in the last two years that Uber has been in Kenya, they have had max sales of under KES 120 million ($120,000) and profits of only KES 16 Million ($16,000). I suspect that the we will see at least two of these rides sharing platforms will exit the market within a years’ time. We have arrived at the final question:
If Uber doesn’t make a significant profit in Kenya, then why should they continue to have operations here and other Sub Saharan African countries?
The conventional wisdom reason for Uber to remain in Sub Saharan Africa, even at a loss, is to collect the data that will enable to be their platform to be a global force when the age of autonomous transport becomes ubiquitous. The validity of this goal will be challenged by the poor infrastructure in our region. If Uber succeeds with this future goal, then living with slim pickings in Kenya will have been worth it.
However, as I am cognizant of Uber’s well-documented losses and barring an unlikely local economic miracle that adds hundreds of thousands of citizens to the Kenyan middle class, it is my opinion that the failure of Uber Kenya to make a significant profit will result in an exit of the Kenyan market within the next three years.


5 Comments